Share

LinkedInFacebookTwitter
Copy to clipboard

Copied

If you’ve read this newsletter for a while, you’ll have seen our over and undervalued model.

It’s a way of figuring out if an area looks a bit cheap or a bit expensive.

For instance, Auckland currently looks about 9% undervalued. So it could be a good place to invest.

This is one of the main tools I use with my clients and investors when deciding where to buy.

The other day, an investor asked: “Does this actually work? Will it really help me make more money?”

So, I ran the numbers to see what would happen if you blindly bought properties in undervalued areas. Let’s start back in the year 2000.

Where was the best place to invest in 2000?

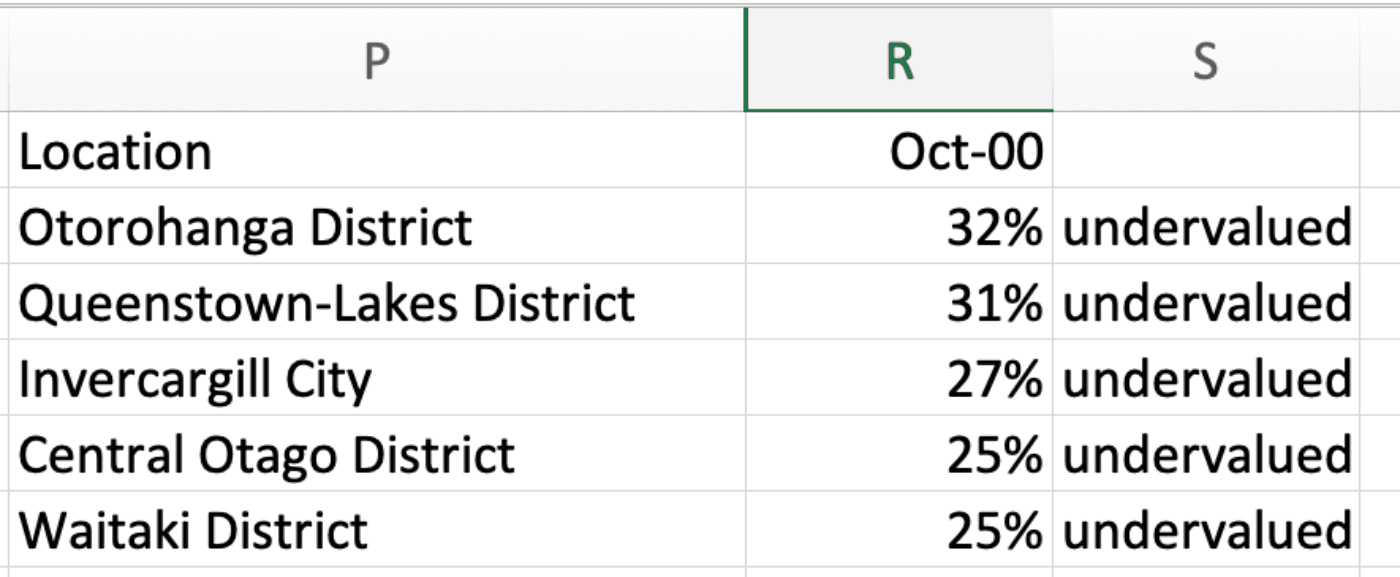
If you crunched the numbers 23 years ago, here’s what you would have seen:

Screenshot 2023 12 07 at 9 31 03 AM

Otorohanga was the most undervalued area (32%), followed by Queenstown (31%).

Looking at that data, I would have invested in Queenstown. Back then, you could buy there for $200k.

So what would have happened if you bought a property there instead of a $200k property anywhere else in NZ?

4 years later, the value of your Queenstown property would have increased by $215,000.

Whereas $200k invested in the average NZ property would have gone up in value by $121,000.

So, you’ve made $94,000 more in 4 years by buying in the undervalued area.

You're feeling chuffed, so you decide to buy again.

Where was the best place to invest in 2004?

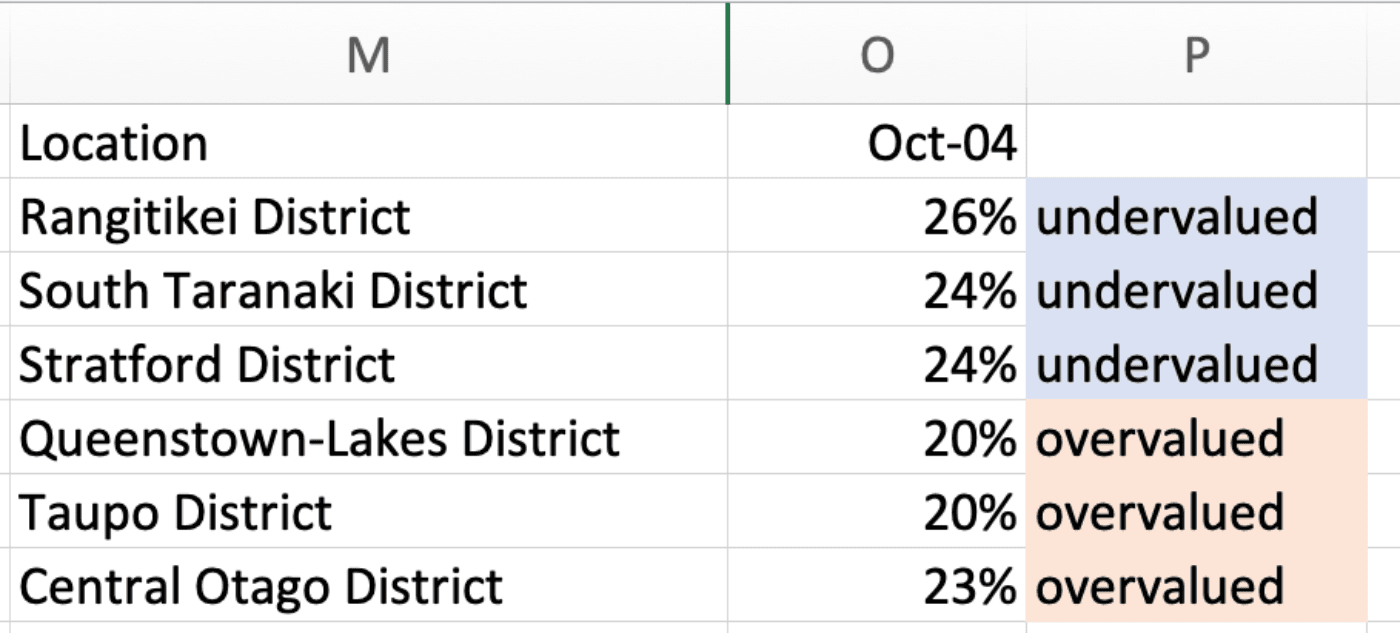
4 years later, here’s what the data looked like:

Screenshot 2023 12 07 at 9 41 46 AM

Queenstown is now 20% overvalued. You wouldn’t invest there, even though the market performed for you.

Instead, the most undervalued areas are Rangitikei (26%) and South Taranaki (24%).

Back then, you could buy a house in South Taranaki for $100k.

So what would’ve happened to a $100k property there vs the average $100k property in NZ?

4 years later, the South Taranaki property increased in value by $83k. That compares to $24k for the average property.

Again, the undervalued area outperformed by $59,000.

Let’s go again 4 years later.

Where was the best place to invest in 2008?

At the tail end of the GFC, Auckland was 8% undervalued. You could buy a property there for $425k.

4 years later a $425k property in Auckland would be worth $237k more. That compares to $122k more for NZ's average $425k property.

Once again, the undervalued region outperforms. This time by $115,000.

Don’t skip ahead. The next one is critical.

Where was the best place to invest in 2012?

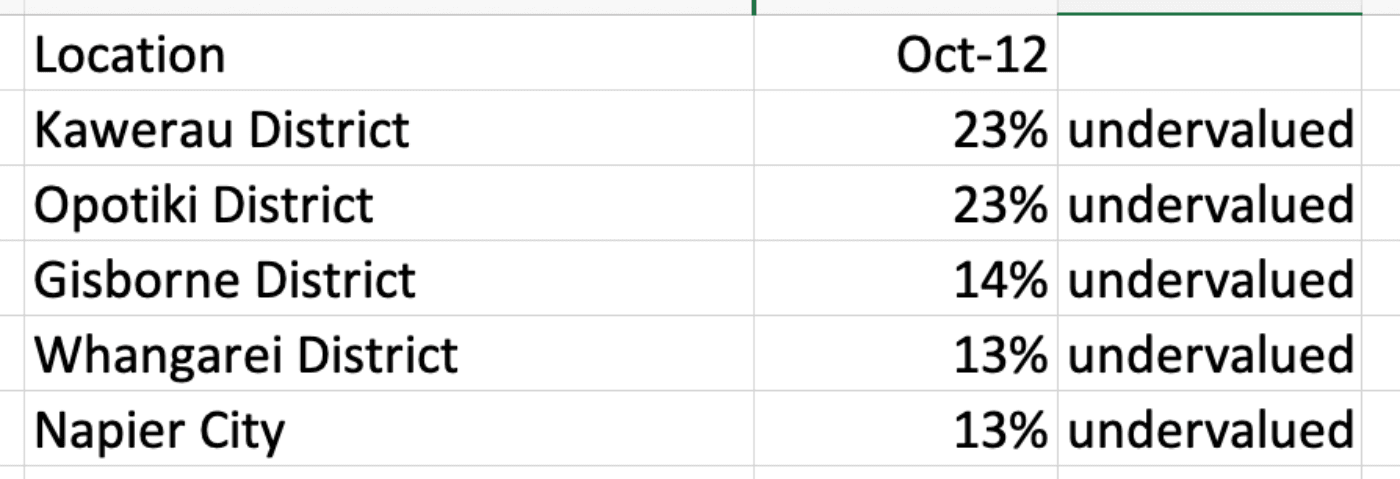
If you re-ran the same model in 2012, here’s where the most undervalued areas were:

Screenshot 2023 12 07 at 10 23 40 AM

A lot of these are smaller districts. So, let’s say you decide to invest in Napier. Back then, you could buy a property for $300k.

Did you get a better return investing in Napier?

No. In this case, the undervalued area underperformed.

The Napier property’s value jumped $108k after 4 years. But the average property in NZ shot up in value by $163k.

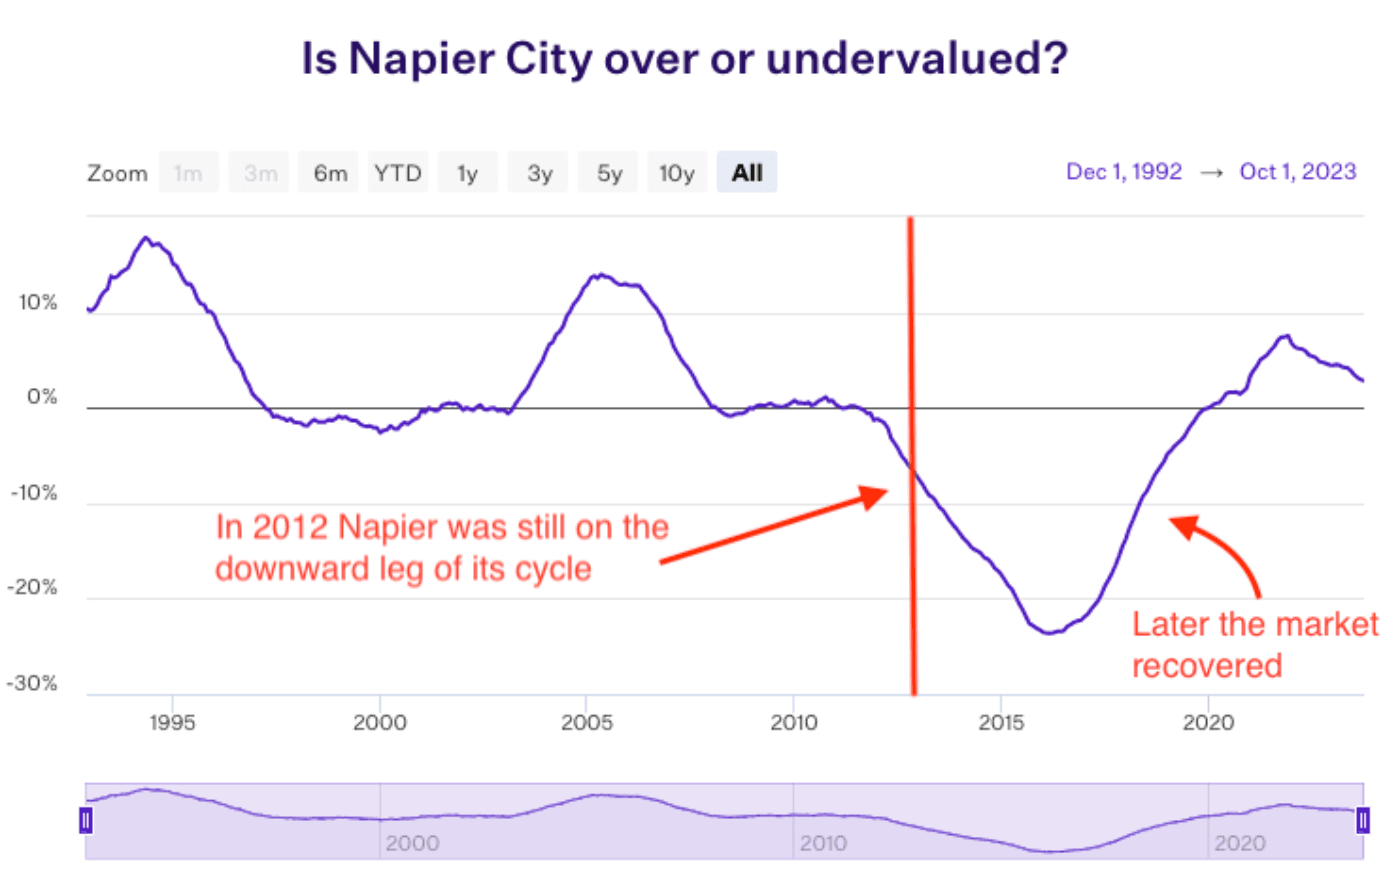
Why did this happen? Well, the model isn’t bulletproof – especially in the short term.

Because Napier was still on the downward leg of its property cycle. It took another few years before it turned around.

Screenshot 2023 12 07 at 10 26 14 AM

That’s the shortcoming of this model. It tells you if an area feels cheap. But it doesn’t tell you when the market will recover.

So, over a fixed 4-year period, this model doesn’t work 100% of the time.

Let’s continue to see what happens if you follow this model every 4 years.

Where were the best places to invest in 2016 and 2020?

In 2016, you would have invested in Whanganui (33% undervalued), spending about $150,000. Over the next 4 years, you would have made $145k.

That’s $106,000 more than if you bought the average property.

Then, in 2020, you would have bought in Christchurch (24% undervalued). You could buy a property for $525k back then.

3 years later, you would have made $174k. That compares to $67k for the average NZ property.

So, let’s add it up. Over 23 years, how much money did we make?

Can you make more money following this way of investing?

If you made the investments discussed in this newsletter, by 2023, you would have made:

  • $3.1 million using the under/over model
  • $2.1 million if you bought the average property

That’s about a 50% better return. An extra million dollars.

Massive. What would that extra $1 million mean for you and your retirement?

Some people think, “just buy a property. It doesn’t matter where. She’ll be right, mate.”

The point of this newsletter is to show that this type of thinking could cost you $1 million.

That’s why, here at Opes Partners, we spend time looking at data so our clients and investors get solid returns.

If you want our help building a portfolio, you can book a free meeting with our team here.

We’ll help you create a property investment plan. Then we have New Build properties you can buy.

Download 5

Andrew Nicol

Managing Director, 20+ Years' Experience Investing In Property, Author & Host

Andrew Nicol, Managing Director at Opes Partners, is a seasoned financial adviser and property investment expert with 20+ years of experience. With 40 investment properties, he hosts the Property Academy Podcast, co-authored 'Wealth Plan' with Ed Mcknight, and has helped 1,894 Kiwis achieve financial security through property investment.

View Profile
Related Private Property Newsletter